
Dashboard
In the left-side menu, the Dashboard is the first feature and serves as the default active page after login. It provides key metrics and useful insights relevant to the merchant for the selected time period.
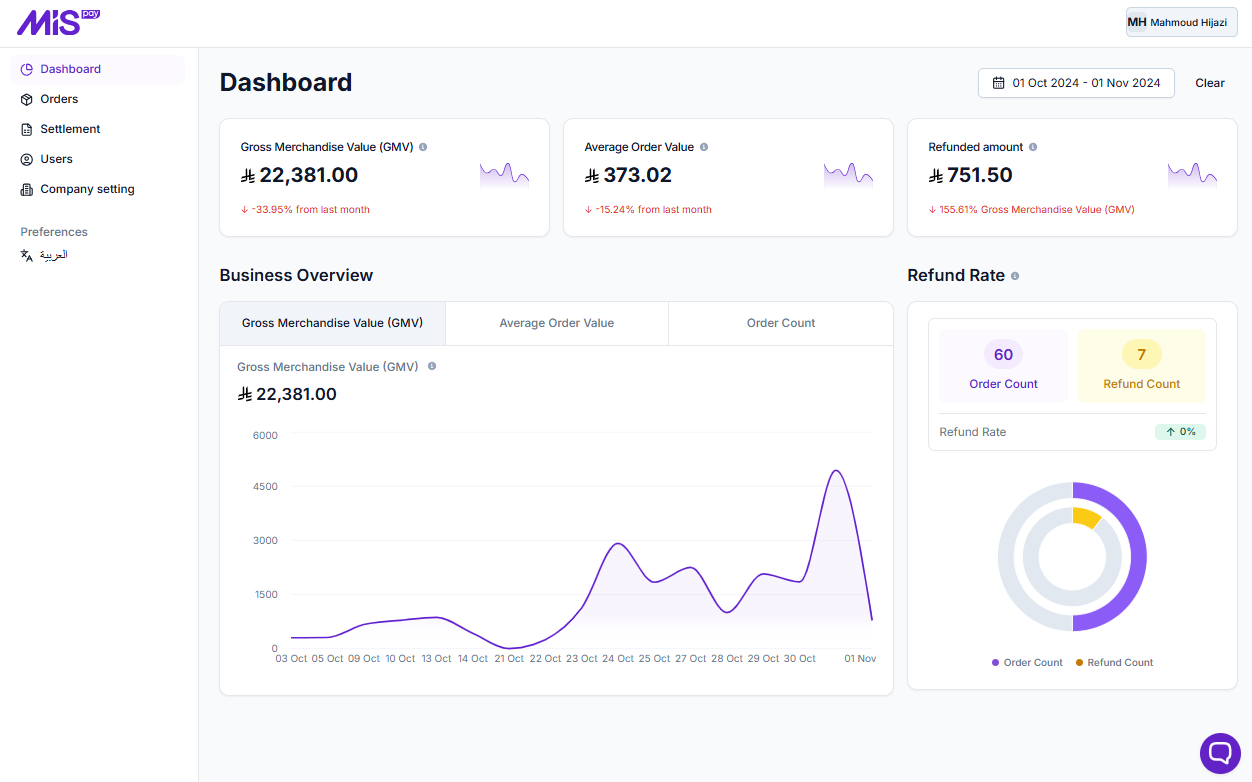
Gross Merchandise Value (GMV)
the total sales value of all products or services sold over the selected period, excluding any discounts, returns, or canceled orders.
Average Order Value
the average amount spent by customers per order over the selected period. It is calculated by dividing the total revenue by the number of orders.
Refunded amount
This is the total amount of all refund transactions performed over the selected period.
Refund Rate
the percentage of orders that were refunded over the selected period. It is calculated by dividing the number of refunded orders by the total number of orders and multiplying by 100.
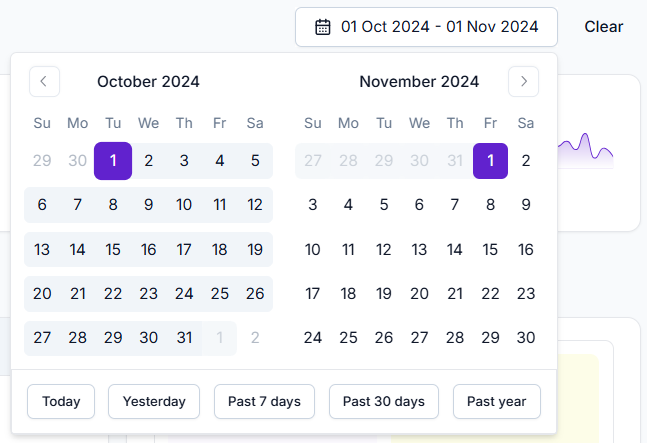
On the right side of the Dashboard page, you can select a time period to display the corresponding measurements
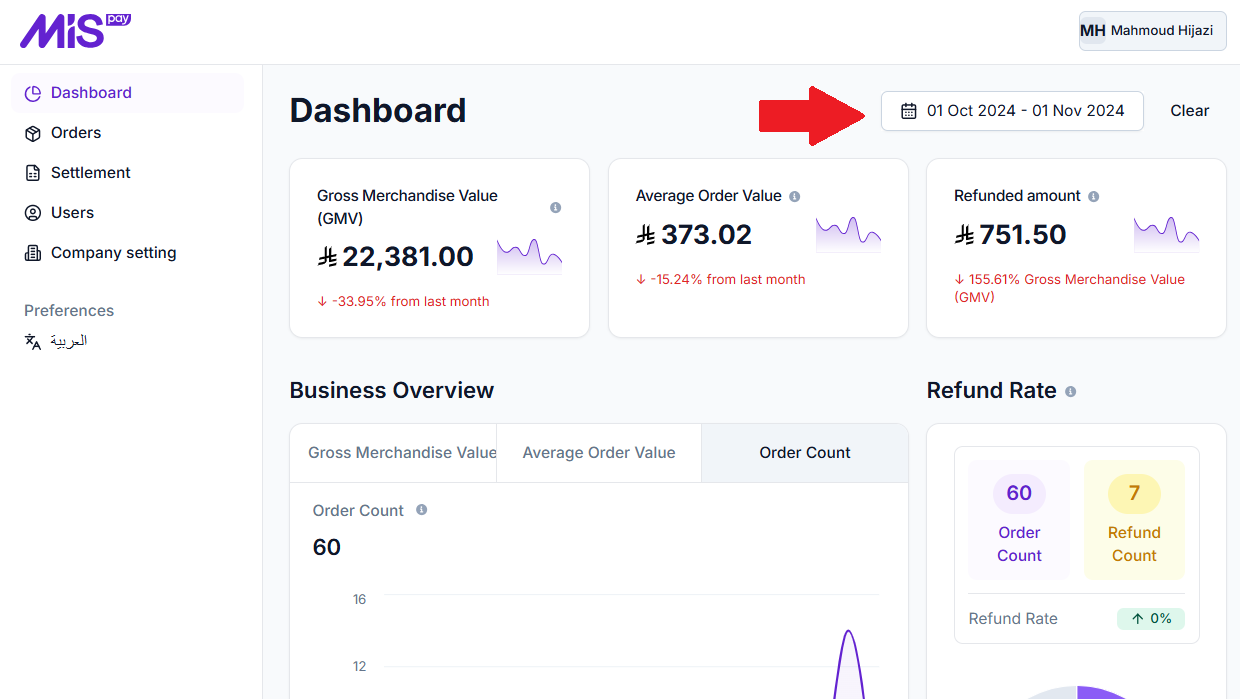
By default, it displays data for the last 30 days from the current date. However, you can click on it to select a different predefined period from the options at the bottom of the calendar or set a custom period by manually selecting a start and end date. To revert to the default 30-day period, simply click the Clear button.
Updated about 1 year ago